Your servers are only as fast as the slowest part, hard drives.To feed other parts of the system we have to add lots of drives to get the desired IO single server can consume.
The basics of how hard drives work has been fundamentally static since the 70’s only refinements in technique and the core technologies have improved. You have a shaft or “spindle” attached to a motor. Disks or “platters” are attached to the spindle. The motor spins the spindle and the platters. Read/write heads controlled by actuator motors move across the surface with very precise motion and access the information stored on the platters. Generally, there is one read/write head per platter surface that is useable.
Simple.
This configuration has worked so well for the last 45 years that every claim to date that X new technology would unseat it just hasn’t happened. That’s not to say it won’t happen, just that hard drives have been “good enough” for the bulk of our storage needs for a very, very long time. Since this is the core of our permanent storage in our database world it is important to have a basic understanding of them.
Description
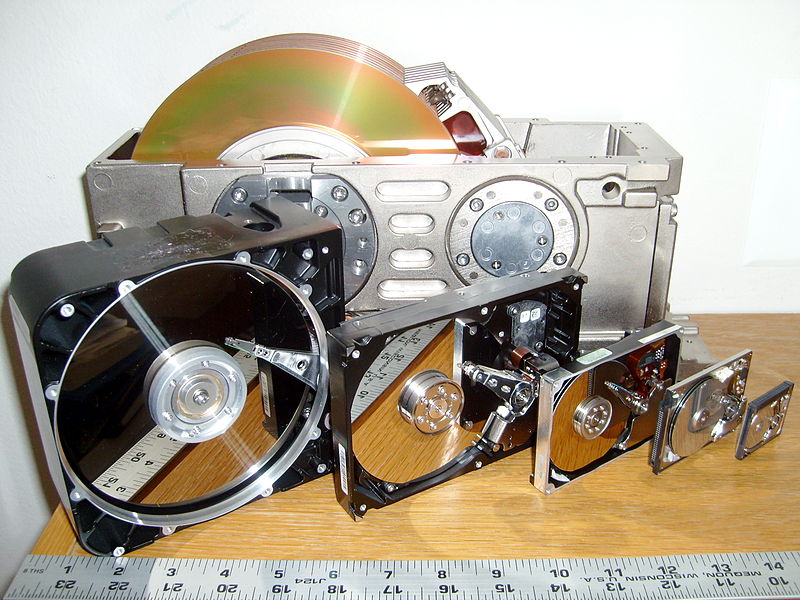
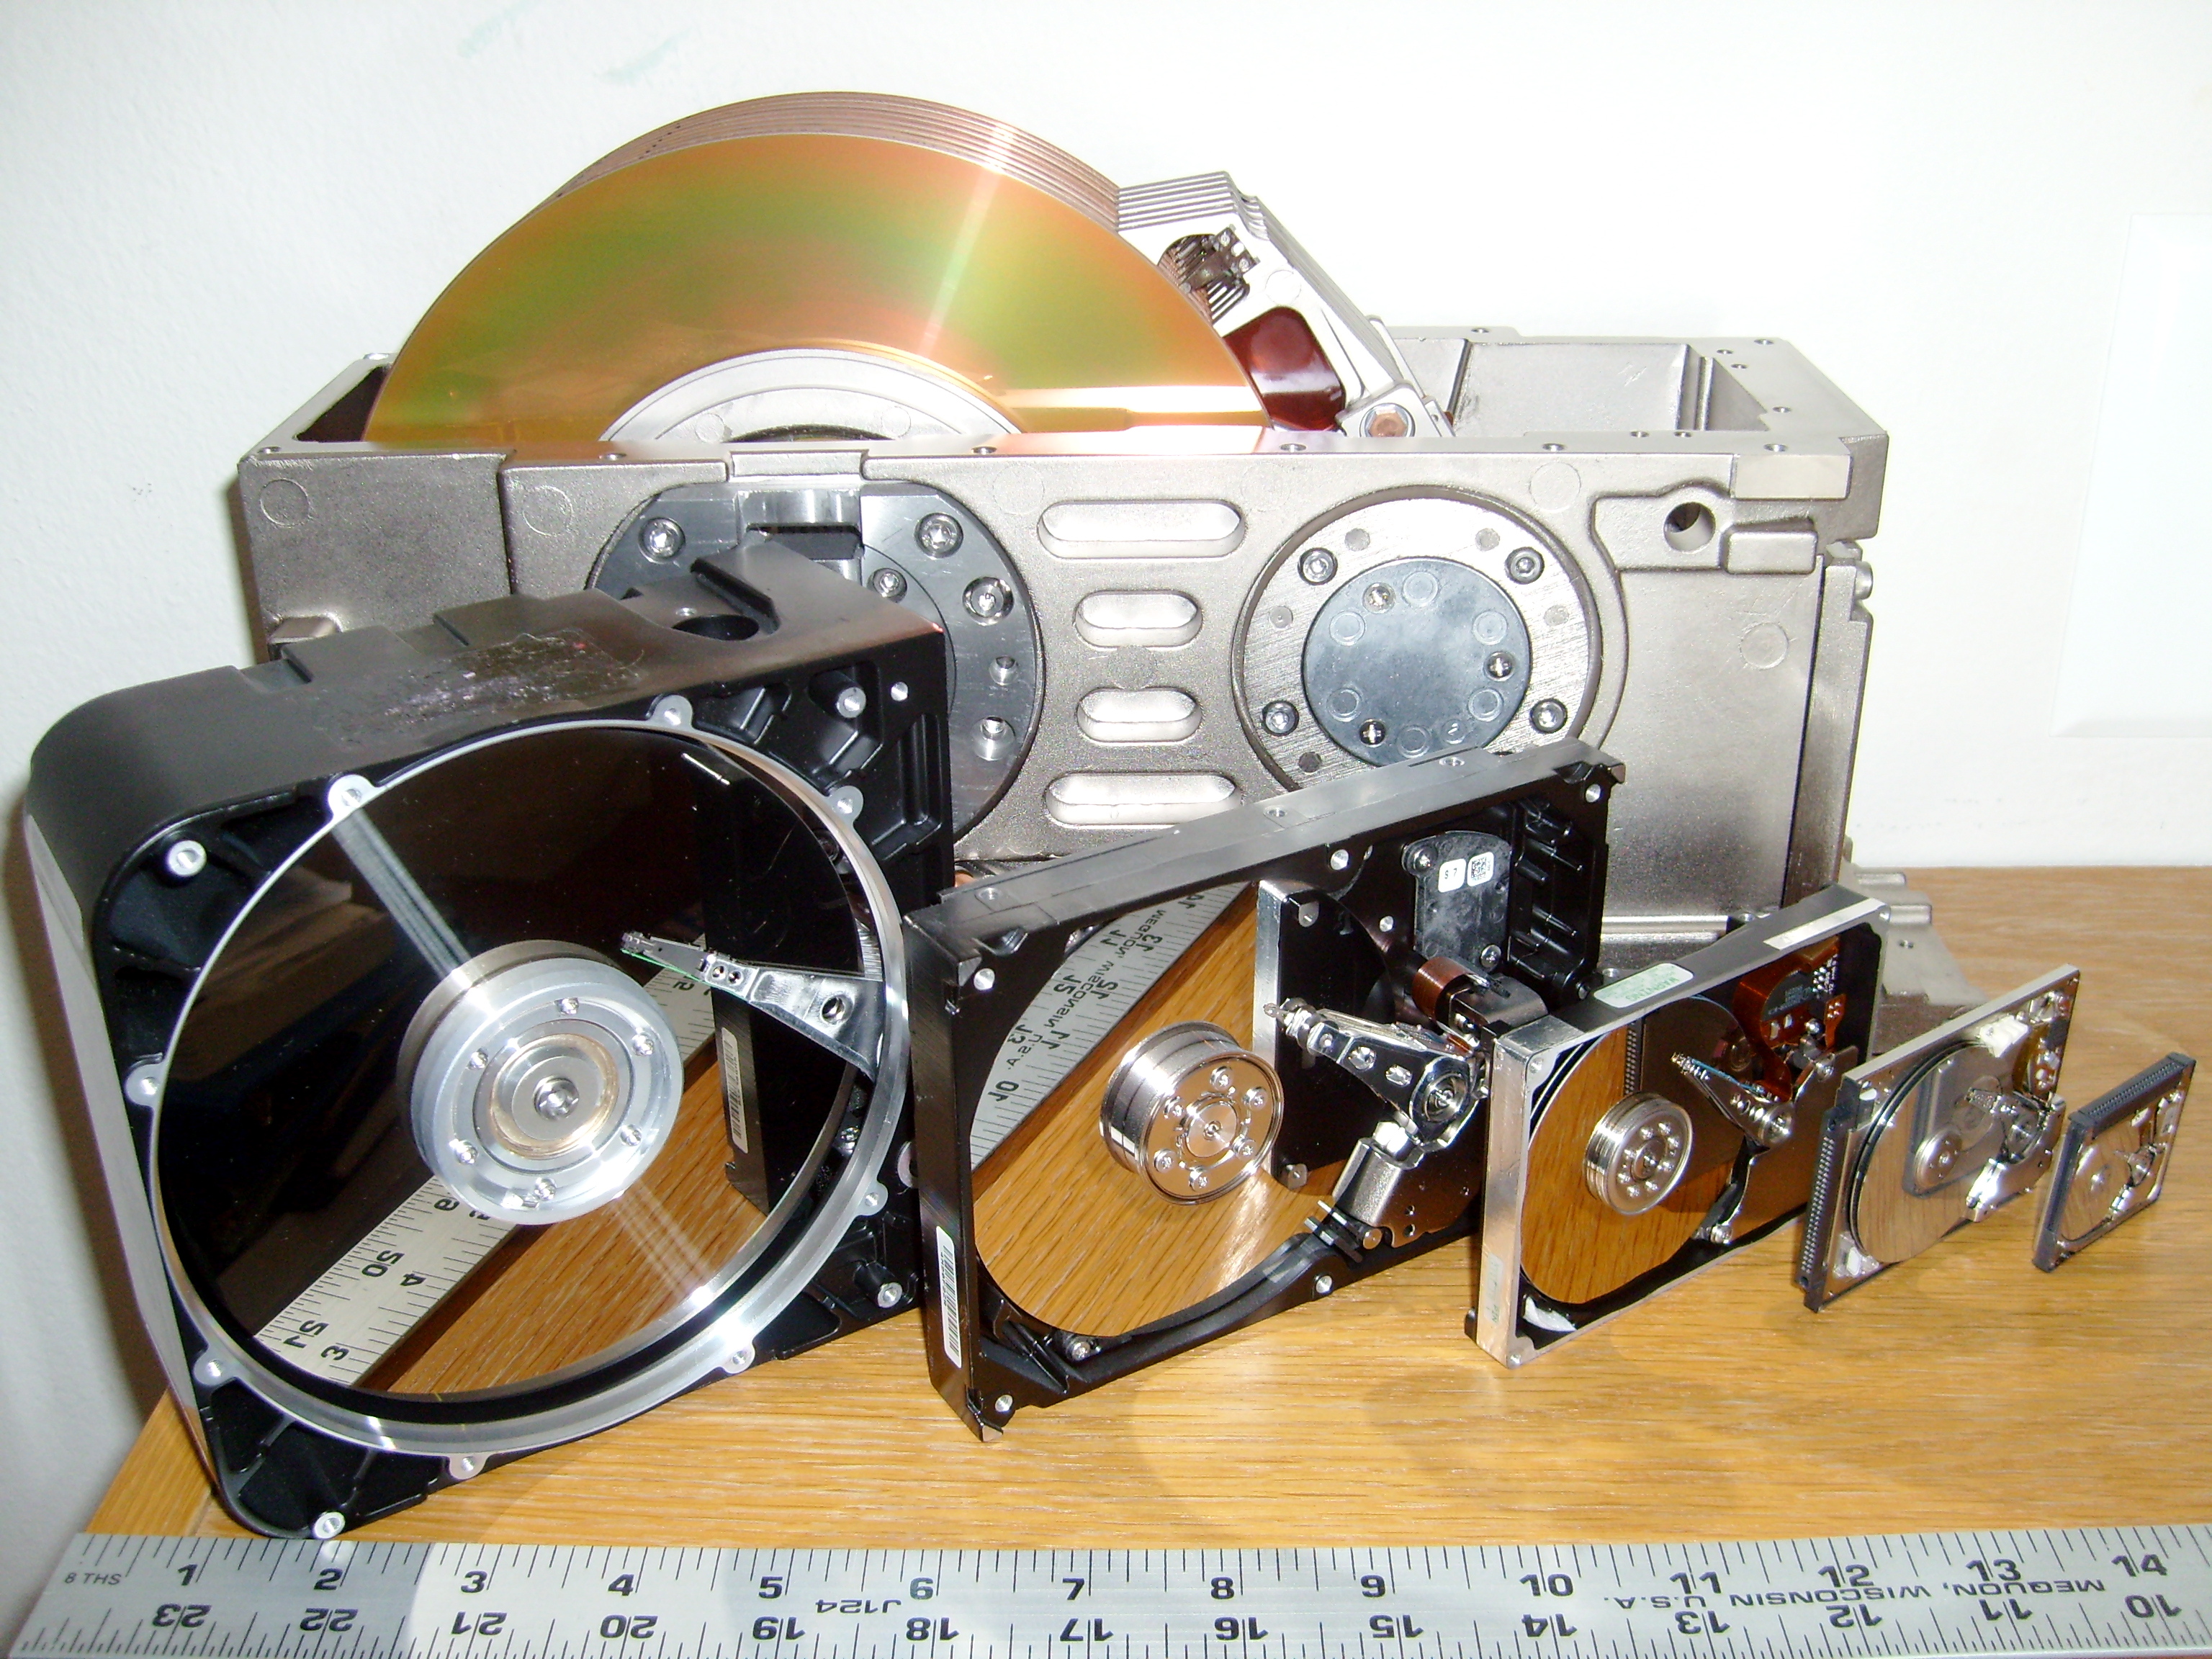
Six hard disk drives with cases opened showing platters and heads; 8, 5.25, 3.5, 2.5, 1.8, and 1 inch disk diameters are represented.
Date
1 March 2008(2008-03-01)
Author
Paul R. Potts
http://commons.wikimedia.org/wiki/File:SixHardDriveFormFactors.jpg
I love this picture. Smaller and faster yet still the same.
To give you an idea of what you are up against lets compare the growth rate of your hard drive VS. your CPU.
Our 1981 machine has a the veteran Seagate ST-412 and a Intel 8088.
Our new computer has a Seagate Cheetah 15k.6 ST3146356SS and a Core i7 965 from Intel of course.
| Time |
Circa 1981 |
Today |
Improvement |
| Capacity |
10MB |
1470MB |
147x (209715x for 2TB drive) |
| Seek speed |
85ms |
3.4ms |
20x (6x for 2TB drive) |
| IO/Sec |
11.4 |
303 |
26x |
| Mbit/Sec |
5 (0.625 MB/Sec) |
1000 (125 MB/Sec) |
200x |
| CPU |
4.77Mhz(.33 MIPS) |
3200Mhz(18322 MIPS) |
5521x |
At first glance we can say WOW what an improvement! Right up until you see how far the processors have come.Everyone is familiar with Moore’s law (Often quoted, rarely understood) loosely applied says CPU transistor counts double roughly every 18 to 24 months.Up until recently, hard drive capacity has been growing almost at the same rate doubling in size around every 18 months (Kryder’s Law). Hard disks haven’t come close to keeping up with that pace, performance wise. Again, the problem isn’t size is speed.
The Makeup of A Modern Hard Drive
“You cannot change the laws of physics” – Scotty
As I stated in the previous section hard drives have remained relatively unchanged since the IBM Winchester drive. Lets take a closer look at the physical structure.
Head, Sectors and Cylinders
So, we have a spindle one or more platters and one or more read/write head, all of that spinning and jittering about at a pretty good clip. So, just how does the computer know where your data is? The platter is broken up into a map of sorts.
Simplistic view:

The platter is broken up into concentric rings and pie slices that allow the drive controller to find the region where the data is.

The heads all move in unison and present a view through the platters that make up a cylinder. I won’t go into great detail on how we have advanced sector and track layouts and the advent of Logical Block Addressing there are plenty of articles on the web that get into those nuts and bolts. What I’m after is to show you physically what has to happen to read the data from the disk and why that is the limiting factor. With the disk spinning at 15,000 RPM the sectors are flying by pretty quickly so the head has to be positioned above the sector and then read or write to it as the platter moves underneath it. The spinning disk, moving the heads and waiting for the data to be read all add up to latency.
Rotational latency is how long it takes the sector we are after to move under the head to be read or written to. Average rotational latency is expressed as half the time it takes for the platter to make one revolution. For our 15k hard drive that number is 2 milliseconds, 60 seconds divided by 15000 RPM divided by 2.
Seek Time is how quickly the disk head can be positioned over a sector to start reading data.
There are to kinds of seek we are interested in, average random seek time and sequential or track-to-track seek times.
In our top of the line Seagate Cheetah our random read seek time is 3.4ms that is the time it takes to get from any one sector to any other sector, usually half the distance from the inner track to the outer most track. Random write seek time is 3.9ms. It is longer due to the process of actually effecting the sector its at before moving on to the next random sector.
sequential is much much faster. If the head only has to move to the next track it can usually do so in under a millisecond.
All this adds up to an average access time. basically, you take the rotational latency plus the average random seek time and any command processing time overhead I usually throw in an additional millisecond. Our Cheetah has a random access time of 6.4ms. Sometimes it may be much faster sometimes it may be much slower but this is a good number to work with as far as planning our storage needs.
The flip side of operations per second is throughput usually expressed in megabytes a second.
This is a direct correlation to the amount of data that can be squeezed into a sector. As drive densities go up so does the average megabytes per second. There is something you should know, the inner tracks are slower on throughput but higher on IO’s and the outer tracks are higher on through put and lower on IO’s. This is just a function of the diameter of the platter getting larger the farther out you go.
It isn’t unusual to see sequential throughput average of around 110 MB/sec and that is only getting better.
Random throughput is not so rosy a picture. I haven’t seen any drive manufactures advertise these numbers from my own testing it can be as little as 15MB/sec up to 40MB/sec. You should test your system to get more accurate numbers.
What It All Means to Us
This boils down to how many I/O operations a single disk can give us. In SQL Server land random IO is king and generally one of the biggest bottlenecks on our data files.For log files, things are a little better. Since logs are written to sequentially you can effectively double the available I/O’s a drive can provide since you have cut our the random access and are much closer to the sequential or track-to-track access.
To calculate the maximum number of random operations we use 1000ms / (seek time[ms] + latency[ms]+overhead[ms])= input/output operations per second.
or
1000/(3.4+2+1) = 155 IOps
Sequential reads get much better since seek times go down from 3.4 to around 0.2.
1000(.7+2+1) = 270 IOps
Almost twice as much! Now you know why we keep our database log files separate from each other and from the data. The amount of disks needed to get the performance is about half. We do the same thing for writes and they will be a little less.
Hard drives suffer from what is known as the “hockey stick” effect the closer they get to 100% utilization the performance falls off dramatically.

Since running a disk at 100% capacity for IO’s introduces the maximum possible latency. The knee of the curve is around 80% we back that off a little more to 75% and that gives us the number of IO’s we have available per hard drive in the storage system in general. This reduces Queuing and keeps latency low, at the cost of maximum number of IO’s. Now our available read IO’s is down to about 117 IOps for random access and 216 IOps for sequential. This number will get better as seek times get better and the command overhead gets better. But remember it will never ever be better than the 2.0ms for the rotational latency. Physics can be a real bummer sometimes. Along with physical spindle speed there have been large improvements with how the drive handles incoming and outgoing request. Through IO Prioritization and advanced command queuing algorithms (Native Command Queuing on SAS/SATA) access times and latencies are kept predictable and as fast as possible.
Series To Date:
- Introduction
- The Basics of Spinning Disks – You are here!
- The System Bus
- Disk Controllers, Host Bus Adapters and Interfaces
- RAID, An Introduction
- RAID and Hard Disk Reliability, Under The Covers
- Stripe Size, Block Size, and IO Patterns
- Capturing IO Patterns
- Testing IO Systems


